
Reports in Detail
Report Navigation
Click "Reports" in the left-hand menu (under the Inventory & Sales module) to open the report navigation page. All reports are grouped and displayed as cards:
| Group | Reports |
|---|---|
| Cockpit | Business analysis, Daily report, Monthly report |
| Customer analysis | Customer profile, New/old customer analysis, Region analysis, Customer statement, Sales receivables summary |
| Product / inventory analysis | Product profile, Product sales overview, Slow-moving analysis, Negative stock summary |
| Sales / salesperson | Sales performance report, Sales detail report, Salesperson profile |
| Orders / delivery | Over-due order analysis, Sampling analysis |
| Finance | Annual income & expense report, Collection rate analysis, Supplier statement, Purchase payments summary |
Click any report card to open its detail page.
TIP
There are quite a few reports. Below we pick the commonly used ones to explain in detail by usage frequency; for the rest, see the table above for their entry points and purposes.
Statements
Customer Statement
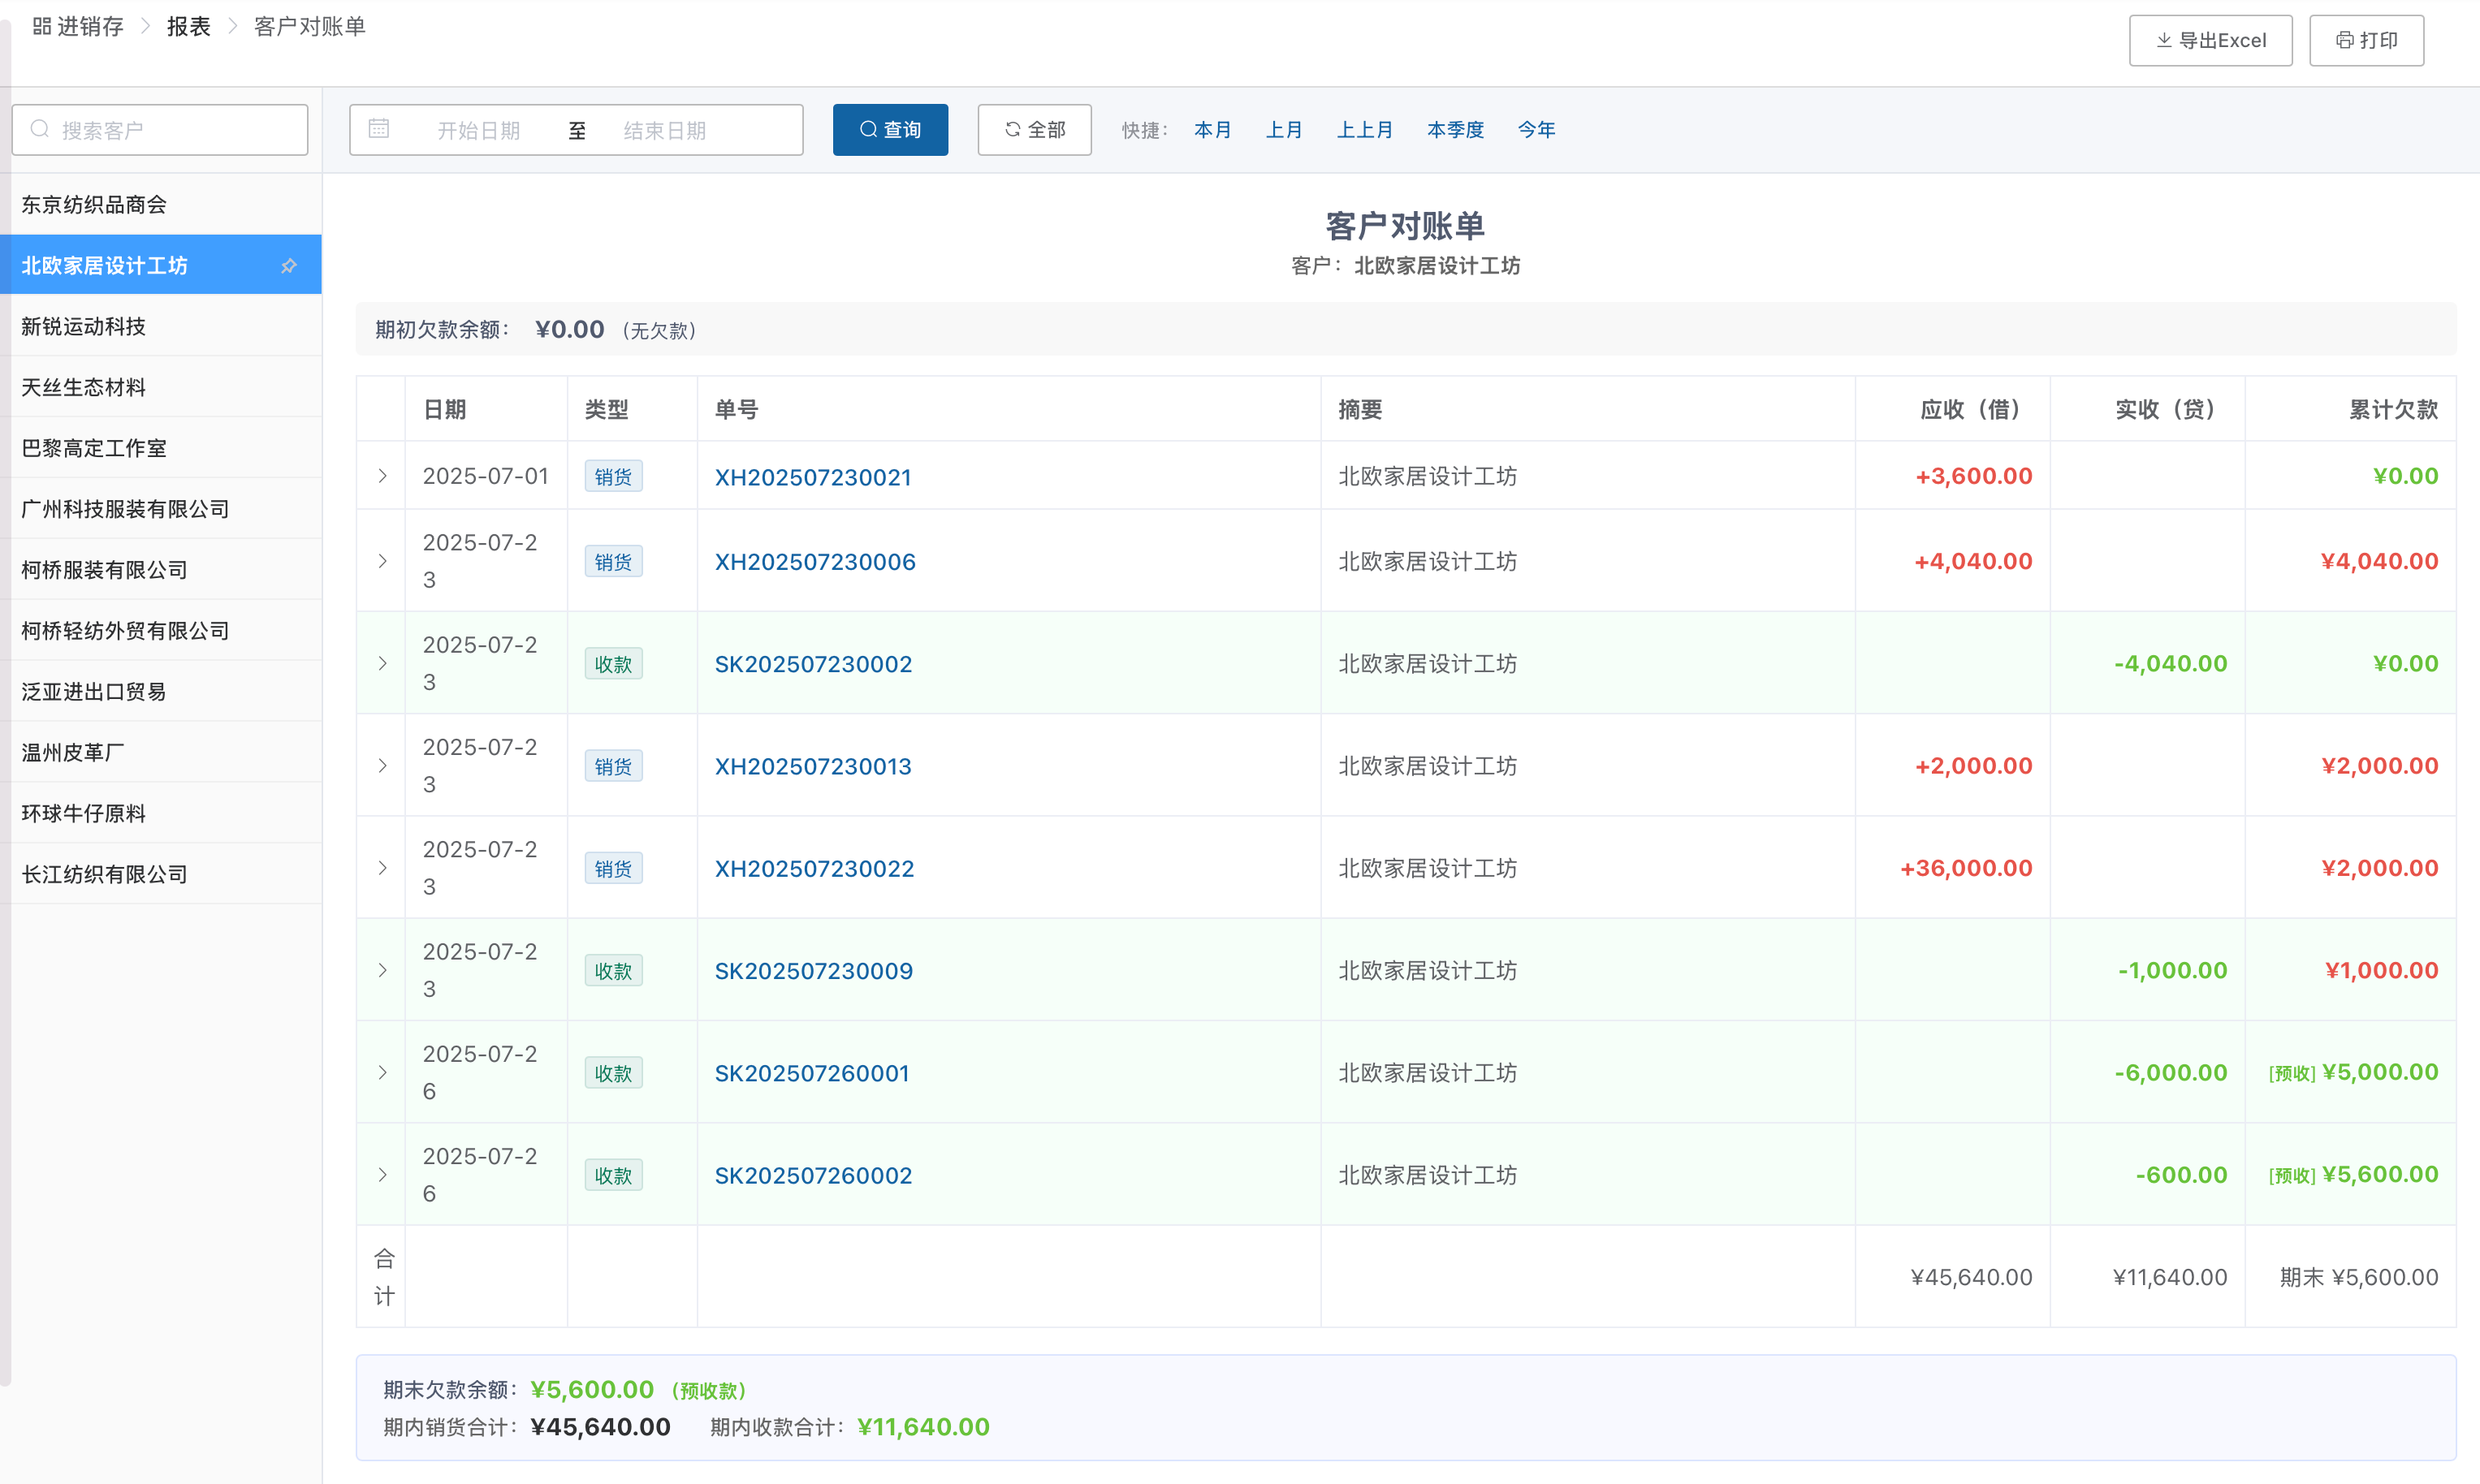
Purpose: Reconcile sales and receipt details with a customer to confirm both sides' accounts agree.
How to use:
- The left panel shows a list of all customers, with search supported.
- Click a customer name; the right side shows that customer's transaction ledger.
- You can set a date range filter.
Ledger composition:
| Document type | Effect on outstanding balance | Notes |
|---|---|---|
| Sales order | Increases outstanding | Delivered amounts count toward receivables |
| Receipt | Reduces outstanding | The customer's payment offsets the outstanding balance |
| Sales return | Reduces outstanding | The return amount offsets receivables (negative) |
Key metrics:
- Opening outstanding: the accumulated outstanding balance before the selected date range.
- Running outstanding: the real-time outstanding balance after each transaction.
- Closing outstanding: the outstanding balance at the end of the selected date range.
Notable features:
- Product details shown inline: the specific products, quantities, and amounts of each sales / return transaction are displayed directly under the document number—no need to click to expand.
- Period quantity totals: the closing summary at the bottom of the statement shows a "period quantity total" grouped by unit (meters / yards / kilograms are totaled separately, never mixed together); the summary bar at the top of the public statement page you share with customers shows the same quantity totals.
- Pin customers: hover over a customer name to reveal a pin icon; click it to pin frequently used customers to the top.
- Export to Excel: click the export button to generate a complete statement Excel file including product details.
- Print: the statement can be printed directly.
- Document traceability: click at the end of each transaction row to view the original sales order or receipt.
Common use cases:
| Scenario | How to do it |
|---|---|
| View a customer's current total outstanding | Don't set a date range; look at the running outstanding of the last transaction |
| View total outstanding across all customers | Don't select a specific customer; view the running outstanding across all transactions |
| The customer has a prepayment | The running outstanding shows as negative, meaning the customer has overpaid |
| Monthly reconciliation | Set the date range to the current month, export to Excel, and send to the customer to verify |
Supplier Statement
Purpose: Reconcile purchase and payment details with a supplier.
It works the same way as the customer statement; the key difference is that the money flows in the opposite direction:
- Customer statement: money the customer owes us (accounts receivable).
- Supplier statement: money we owe the supplier (accounts payable).
| Document type | Effect on outstanding balance |
|---|---|
| Purchase order | Increases outstanding (we owe the supplier) |
| Payment | Reduces outstanding (we've paid) |
| Purchase return | Reduces outstanding (the return offsets payables) |
It likewise supports inline product details, pinning, exporting to Excel, and printing.
Summaries & Rankings
Sales Receivables Summary
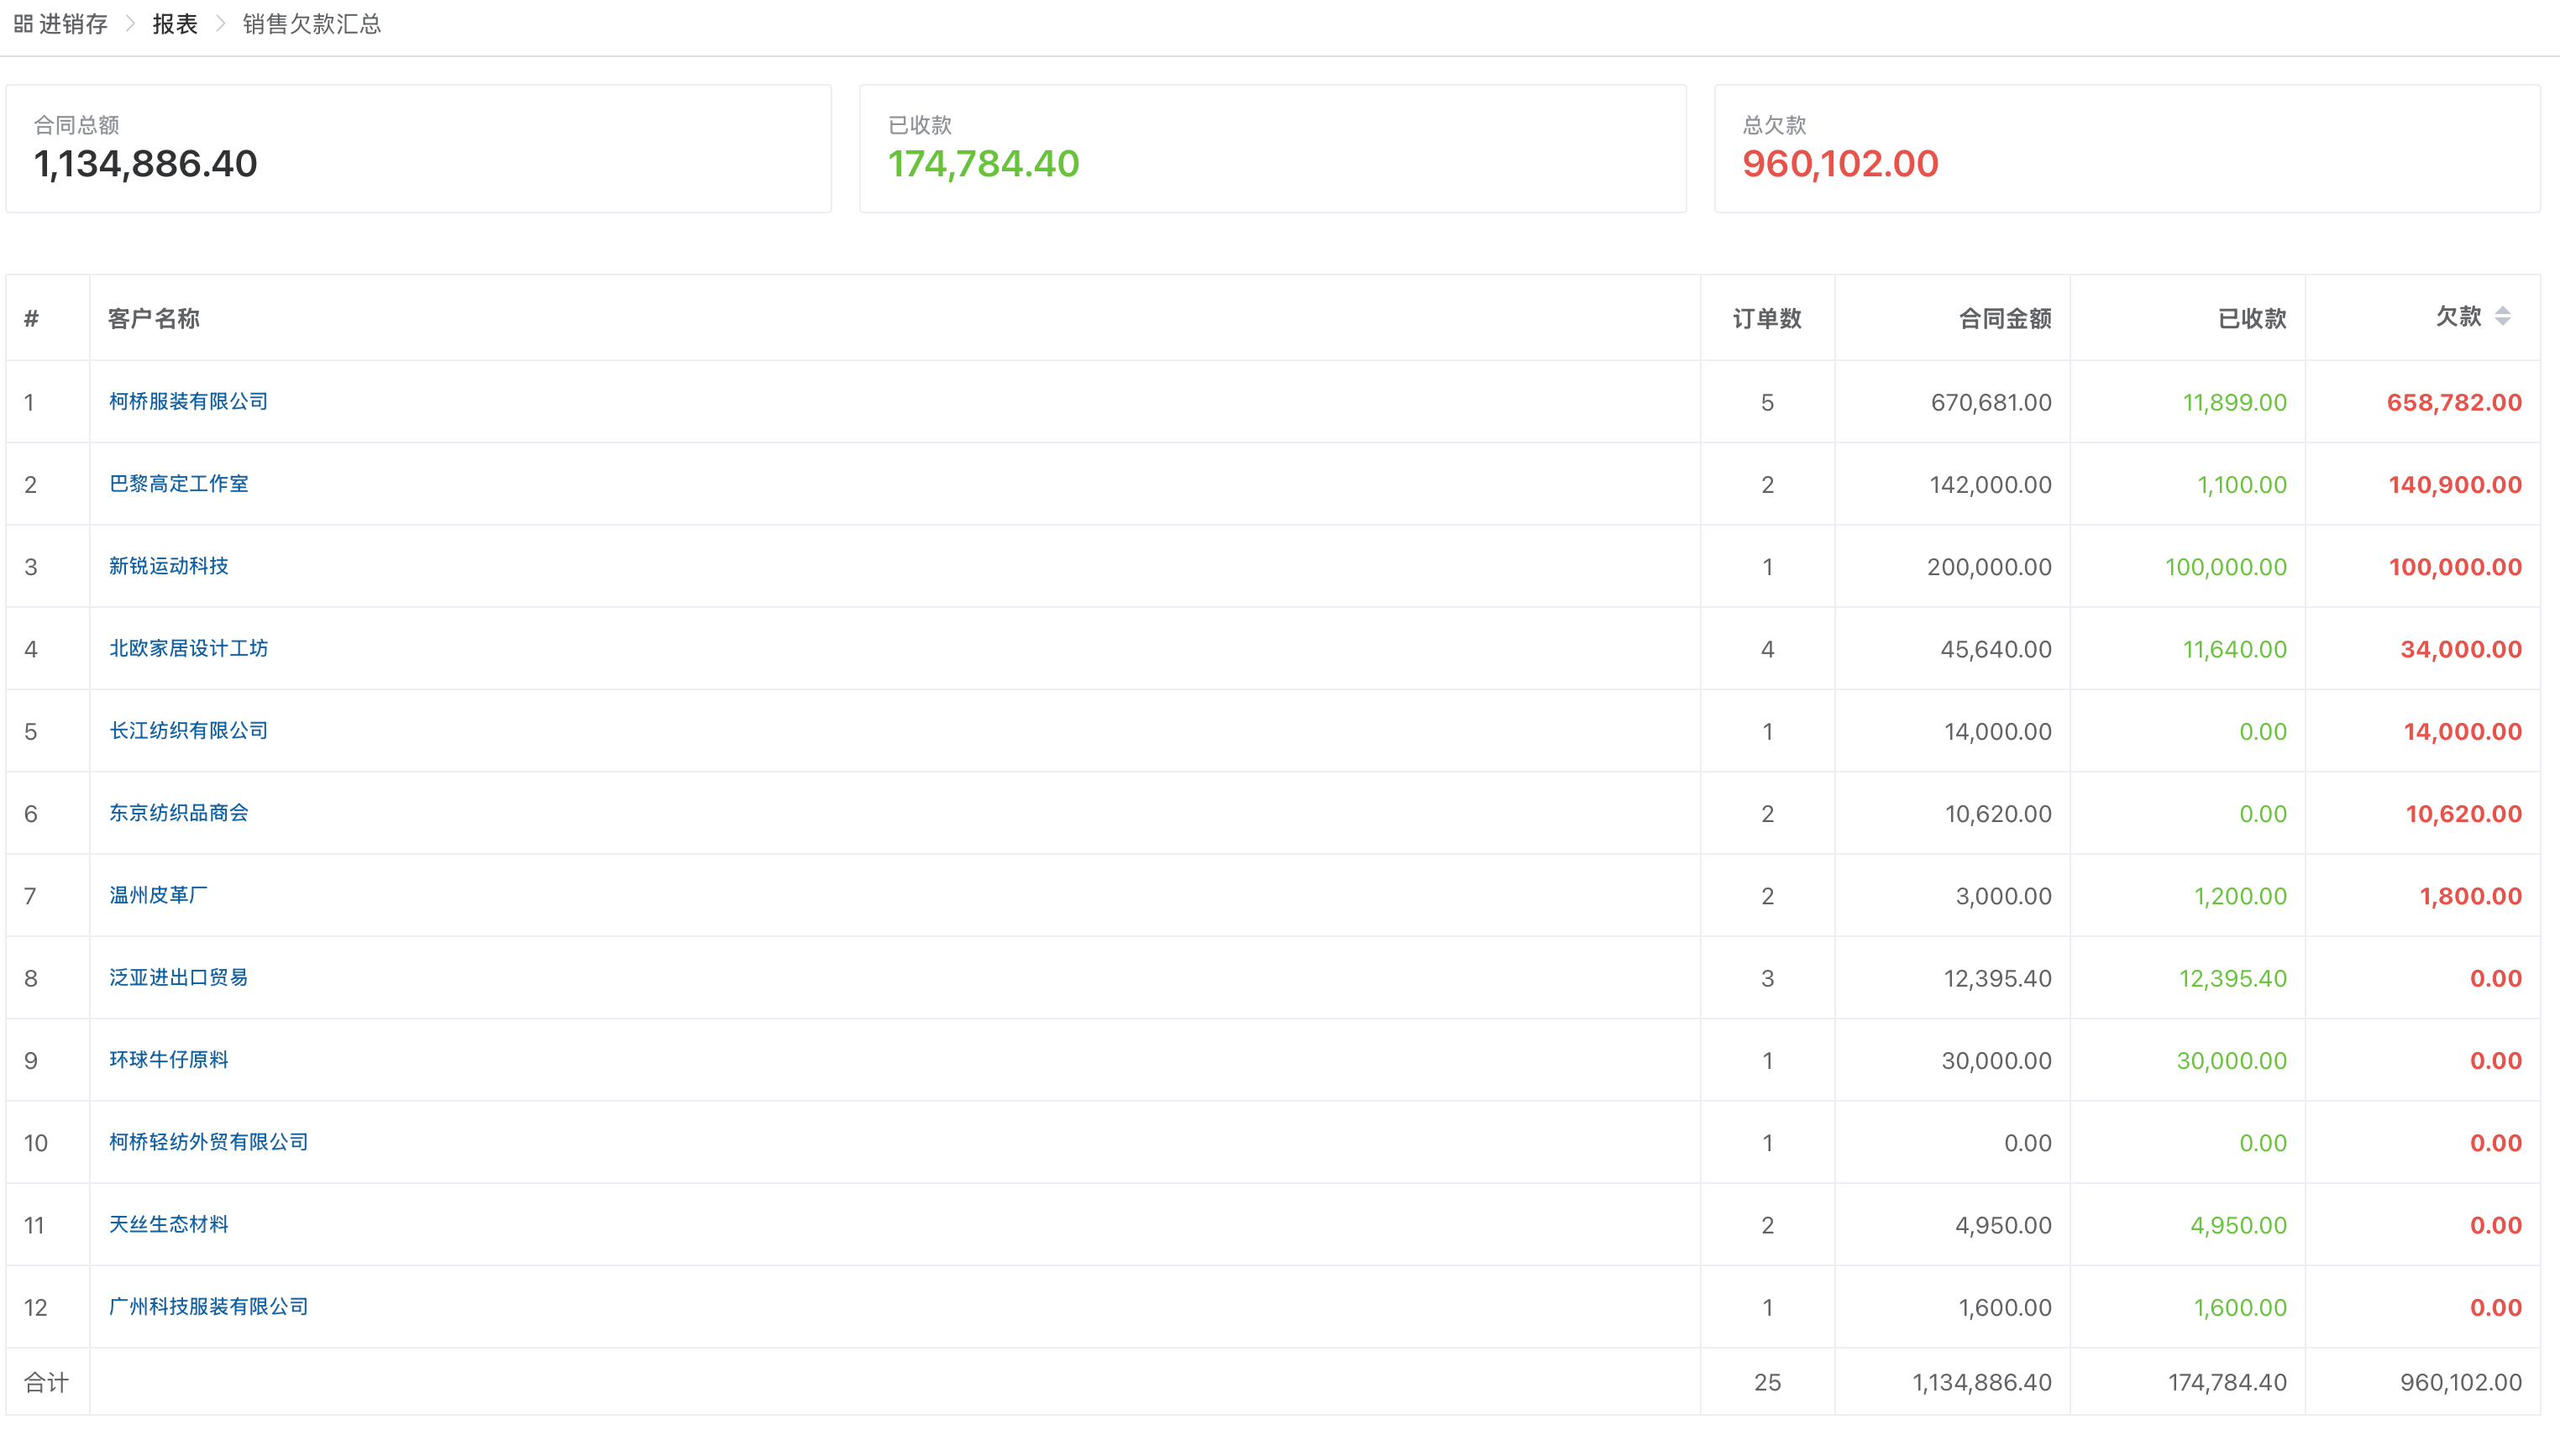
Purpose: See all customers' outstanding balances at a glance and quickly find who owes the most.
Page contents:
- Summary cards: total contract amount, amount received, total outstanding.
- Customer outstanding table: one row per customer, showing order count, contract amount, amount received, and outstanding amount.
- Supports sorting by outstanding amount.
- Click a customer name to jump to that customer's statement detail.
Purchase Payments Summary
Purpose: See all suppliers' payment status at a glance and quickly find who has the most outstanding.
Page contents:
- Summary cards: total purchase amount, amount paid, amount unpaid.
- Supplier payment table: one row per supplier, showing order count, purchase amount, amount paid, and amount unpaid.
- Supports sorting by unpaid amount.
- Click a supplier name to jump to that supplier's statement detail.
Product Sales Overview
Purpose: Track sales data by product to understand which fabrics sell best.
Page contents:
- Date range filter: supports quick options (last month, last three months, this year).
- Total sales card: total sales amount for the selected period.
- Product ranking table: ranked by sales amount, showing rank, number, product name, order count, sales quantity, sales amount, and share.
Negative Stock Summary
Purpose: See which products currently have negative stock so you can replenish in time.
Page contents:
- Summary cards: number of products with negative stock, total negative stock quantity.
- Warehouse filter: view by warehouse.
- Negative stock table: shows photo, number, product name, color, warehouse, stock quantity, and pieces.
Performance & Cash Flow
Sales Performance Report
Purpose: Track sales performance by salesperson, used for performance reviews.
Page contents:
- Date range filter
- Salesperson filter: select from a dropdown to view a specific salesperson.
- Performance data: contract amount, amount received, amount outstanding.
- Supports expanding to view each salesperson's specific order details.
Sales Detail Report
Purpose: View sales details by salesperson, switchable between summary and detail modes.
Page contents:
- Display modes: summary view (same product and color merged into one row; click + to expand each sale) or detail view.
- Time filters: today, yesterday, this week, last week, this month, last month, this quarter, last six months, full year, custom.
- Salesperson collapsible panels: one group per salesperson; expand to view the sales details under that name (date, sales order, customer, product number, product name, etc.).
Annual Income & Expense Report
Purpose: Track full-year income, expenses, and profit by month to keep tabs on business performance.
Page contents:
- Year selector: switch to view different years.
- Summary cards: annual total income, total expenses, total profit.
- Monthly detail table: one row per month, showing income, expenses, and profit.
- Profit is shown in red when negative.
Business Decisions
Business Analysis
Purpose: Get a top-down view of business performance and analyze the aging of receivables and payables.
Page contents:
- Key metric cards: total receivables, total payables, total account balance, estimated inventory value (estimated using the most recent purchase price). For companies with Order Production enabled, total payables now includes outsourced processing fees, so the number reflects reality.
- This year's production order profit: a per-order roll-up of net revenue and profit margin for this year's production orders, using exactly the same calculation as the per-order profit shown on the order detail page — the two always match.
- Aging analysis: toggle between receivables (customers) and payables (suppliers), with details displayed across aging buckets of 0–30 days, 30–60 days, 60–90 days, 90–180 days, and 180+ days.
Visibility of the "This year's production order profit" card
This card only appears when the company has Order Production enabled and the current account has the "Orders – View Profit" permission; for inventory-and-sales-only companies, the page is completely unchanged.
Business Data Dashboard
Purpose: Put receivables, payables, account balances, sales flows, production progress, and other core business data on a big screen / TV so the boss can see the whole picture at a glance.
TIP
The Business Data Dashboard is the upgraded and renamed successor of the old "Production Board" big screen, and is now open to all companies — Order Production is no longer required.
Entry point: it is not on the report navigation page; instead, click "Business Data" in the left-hand menu and the dashboard opens in a new browser tab, ideal for leaving on a projected screen.
Page contents:
- Receivables / Payables / Account balance: three financial metric cards; payables includes outsourced processing fees.
- Profit data: same calculation as Business Analysis — the two always agree.
- National sales flow map: visualizes sales flows from the shipping province to each customer's receiving province; the shipping province is configured in the settings drawer opened via the gear icon in the top-right corner.
- Sales trends, top customer rankings, production progress, real-time document feed, and other visual modules.
Access control:
- By default, only the company owner can see it.

- The owner can authorize specific employees under "System Settings → Order Production Settings".
- Unauthorized employees won't see the "Business Data" menu entry, and direct access to the page is blocked as well.
Inventory-and-sales-only companies
For companies without Order Production, the dashboard automatically hides production-related metrics and shows only inventory, sales, and financial data — no interference from production features.
Related Articles
- Inventory & Sales in Detail — Sales, purchases, funds, and other operations
- Production Order Management — Where production order profit, outsourced processing fees, and related figures come from
- Contacts & Data Permissions — Data permissions affect what's visible in reports